In 2009, an anonymous genius (or group of geniuses) created a “peer-to-peer electronic cash system” that virtually NO ONE at the time thought would garner substantial adoption…
Let alone change the world.
But since then, bitcoin has unleashed a powerful movement that cuts across finance, economics, politics and technology.
The cryptocurrency (or digital currency) boom that began with bitcoin has exploded into nothing short of a revolution.
Right now, there is NOTHING bigger than cryptos.
I’ve known about cryptos for many years… but I first bought bitcoin in 2013 at $84.c
As I write this, bitcoin’s price is more than 7,000% higher than it was back then.
Enough to turn a mere $1,000 into a six-figure fortune.
To tell you the truth, I got hooked on cryptocurrencies when I first started trading years ago… WAY before the media caught on.
What fascinated me the most about cryptos was their predictability. That might sound strange to many, but I’m quite certain of this.
Since I first started investing in cryptos, I’ve noticed an unmistakable pattern that repeats over and over. In fact, it’s probably the most profitable pattern I’ve ever seen in financial markets.
We analyzed some of the biggest crypto winners ever and found that this pattern shows up most of the time before a huge move.
Cryptocurrencies have profit potential like nothing the world has ever seen before.
And I believe identifying THIS pattern in promising cryptos is the key to unlocking those fortunes for yourself.
It’s a chart pattern that I call “Nakamoto’s Pattern.”
It’s a telltale pattern that lets you know – with striking accuracy – the ideal time to buy…
I named it Nakamoto’s Pattern after the pseudonymous name of the creator(s) of bitcoin, “Satoshi Nakamoto.”
When these once-tiny cryptos form this unique pattern, they almost always undergo an explosive transformation.
And once you learn to identify it, this unmistakable pattern will allow you to spot the ideal buying point…
Instead of having just blind faith.
In this report, I’m going to pull back the curtain and show you exactly how this pattern works…
And how you can use it to amass a personal fortune in the crypto boom.
Nakamoto’s Pattern… Unveiled
It’s time to get a bit technical, so bear with me…
Because it’s vital that you understand what I’m about to unveil.
Behind everything in nature, there is a mathematical order. In fact, it’s so intrinsic to how the world works, it’s even present in financial markets.
But I don’t want you to get the wrong impression. I’m NOT talking about some sort of mystical force.
I’m talking about simple mathematical truths that oftent present themselves in human behavior.
One such example is a special set of numbers called the Fibonacci sequence.
The Fibonacci sequence is a series of numbers with a unique quality: Every number in the series is equal to the sum of the two preceding numbers.
If you start with the numbers 0 and 1, the next number in the series is 1 (0 + 1), then 2 (1 + 1) and so on.
Here’s a list of the first dozen numbers of the Fibonacci sequence:
Now, before we get off track here, let me explain why this is important…
You see, if you take any number in the series and divide it by the next number, you’ll get a very unique result.
The further up the sequence you go, the more precise this result gets. Every pair of numbers, when the first is divided by the second, comes ever closer to a specific ratio:
And again, the higher the numbers are in the sequence, the more and more precise this figure gets.
But the Fibonacci sequence is not a mere mathematical gimmick. It’s TRUE power stems from its uncanny ability to explain real-world patterns…
Like the population growth of rabbits… the structural design of flowers and spiral seashells…
And, I believe, even the price action of certain financial markets.
For whatever reason, crypto markets tend to respect these levels.
Now, let’s bring this back to our original topic: Nakamoto’s Pattern.
In my years watching the crypto market, I’ve noticed that this unique ratio – 61.8% – is the key to understanding which cryptos pop or flop.
Because it’s THIS ratio that determines whether a crypto is preparing for its next major rally.
Here’s what I mean…
First, you’ll need to identify a crypto that’s just had a bull rally and has started to pull back.
If you calculate the price difference from the bottom to the top of the previous rally – that is, the “spike” in the price – all you need to do is take 61.8% of the price difference and subtract it from the high.
That’ll give you the support level at which the crypto is expected to turn around… and potentially skyrocket past the previous high.
To simplify this process, I’ve distilled it down to a simple formula:
The result is something called a Fibonacci retracement level, a.k.a. the support line.
But all you need to know is that it’s a mathematically precise price level that uses that 61.8% ratio to determine – with high probability – where a price trend will turn around.
You may be starting to get confused, so let’s take a look at a real-world example: bitcoin.
In July 2017, bitcoin saw a huge spike that nearly tripled its value in less than one month.
Using prices from the popular cryptocurrency exchange Coinbase, bitcoin rose from a low of $1,758 to a high of $4,980 in less than 30 days!
Then its price started to fall…
The media was convinced that bitcoin was in a bubble and that its investors had just witnessed its final run-up before an inevitable crash.
Bitcoin’s value fell by more than half in just a couple of weeks.
But the media was DEAD wrong…
It had no idea what was happening… no clue about the predictable transformation that was unfolding in front of them.
It was Nakamoto’s Pattern!
Take a look at bitcoin’s price chart from that summer and you’ll see exactly what I mean.
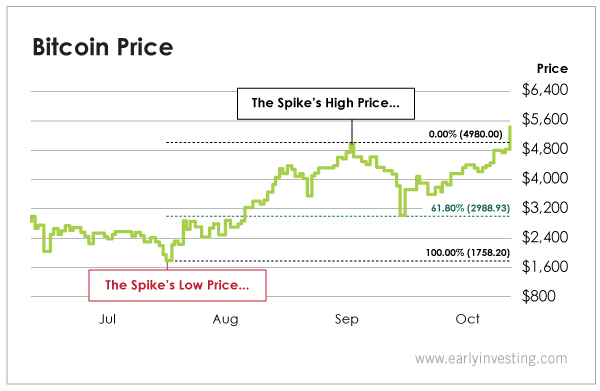
You see that green line in the middle of the chart? That line marks our Fibonacci retracement level… or the price level where we can look for the price to stop… turn around… and climb back up.
All you needed was the previous rally’s low and high price to figure this out.
As you can see, bitcoin’s price stopped exactly on that line… then proceeded to rise back up.
As a result, look what happened next…
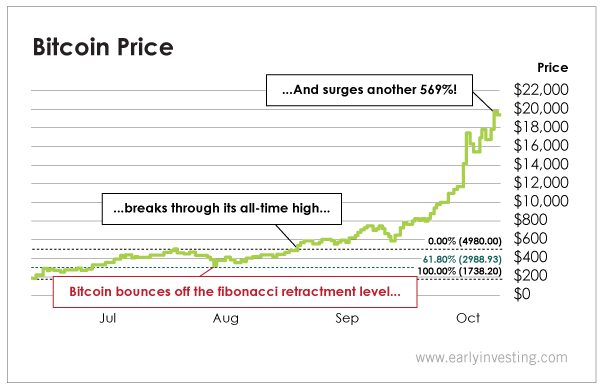
If you had known about this precise mathematical pattern, you could have positioned yourself to collect as much as 569%…
Enough to turn $1,000 into $6,690… in less than three months.
This is the wealth-creating power of the crypto market… but only once its behavior is properly understood.
It’s how I’ve made my own money in cryptos… and how you will too.
Of course, not every crypto meets this pattern. Some cryptos plunge past the Fibonacci retracement level.
Usually, that’s a bad sign. But in this service, we recommend only high-quality cryptocurrencies and use this pattern to help with timing…
The reason is simple. All market behavior depends on crowd psychology… and understanding those peculiar human behaviors is the key to making big money in the market.
The truth is… we have no idea why traders unknowingly obey these mathematical patterns. They just do. And now that there are algorithmic crypto traders in the market, they tend to use these levels as well.
So, as you can see, these levels matter, even if there’s no fundamental reason they “should.”
What I care about is that they DO obey these patterns, whether they want to or not. And because they so often do, we can exploit them.
That’s the secret behind Nakamoto’s Pattern: It allows us to exploit our most unconscious behaviors to make a lot of money. That’s it.
Now, I have a confession to make…
I’m not the only person who’s uncovered this pattern. In fact, there are quite a few top traders in the world who use this same pattern to make money trading paper currencies.
But few traders have EFFECTIVELY translated that trading knowledge to the burgeoning world of cryptos. That’s why the few who have are able to make a killing in this market…
While everyone else is guessing blindly!
So now that you know how Nakamoto’s Pattern works, you’ll be able to understand the recommendations I’ll be making for you.
It’s a simple three-step process…
- Look for a big spike in price.
- Watch for a pullback to the support line.
- If it bounces off, get your money in and hang tight!
As a subscriber to my research service, I’ll be sending you my fully vetted crypto recommendations that are forming this pattern.
But I’m going to take it a step further…
You see, at heart, I’m really a long-term investor. I’m interested in projects that I believe will last a long time… projects that offer real solutions to real problems.
So I won’t be recommending just ANY crypto that forms this pattern…
I’ll be recommending cryptos that have rock-solid fundamental-use cases. This is how I got in early on Ethereum, bitcoin and many other coins.
Whenever possible, we’ll be using Nakamoto’s Pattern to optimize our entry point.
Two More Trading Tools to Help Boost Your Crypto Profits
You’ve already seen the immense power of Nakamoto’s Pattern…
But there are a couple more tools that I like to use when researching potential cryptos to trade.
One of them is actually very simple: Search for volume on Google.
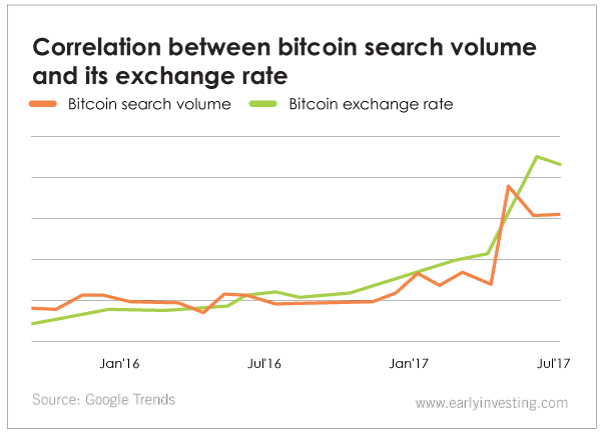
Believe it or not, it’s been proven that bitcoin’s price movements have a unique correlation with how many Google searches are made for bitcoin-related topics.
A study by SEMrush, a leading search engine marketing firm, suggests that there’s been a 91% correlation between bitcoin’s price action and Google search volume related to bitcoin.
And it’s not just bitcoin. Another of the largest cryptos in the market today, Ethereum, has shown a similar correlation as well.
Here’s a chart from Google Trends demonstrating this point below:
That’s all to say that an important detail I like to look at when researching cryptos is search volume.
I want to know that other people are becoming interested in the project… informing themselves… and possibly preparing to get in.
It’s a good proxy for demand… and every trader knows that it’s ultimately buying demand that drives up prices.
Now, onto another tool I like to use…
Most investors aren’t too familiar with this one, but stock and crypto traders both use it quite often.
It’s called the Relative Strength Index, or RSI for short.
It was developed in the 1970s by a commodities trader named J. Welles Wilder. It’s meant to track an asset’s price momentum.
RSI ranges from 0 to 100. Most stock traders use the following rules when trading with RSI…
- When RSI is below 30, the stock is “oversold.” That means that selling pressure is outweighing buying pressure. You’ll want to wait for RSI to cross above 30 before getting into the stock.
- When RSI is above 70, the stock is “overbought.” That means that buying pressure is outweighing selling pressure. You’ll want to wait for RSI to cross below 70 before selling the stock.
The same rules can be applied to cryptos.
Now, here’s an interesting example…
Let’s take a look at the same chart of bitcoin we went over earlier from the summer of 2017. This time, I’ll show you an RSI chart alongside it.
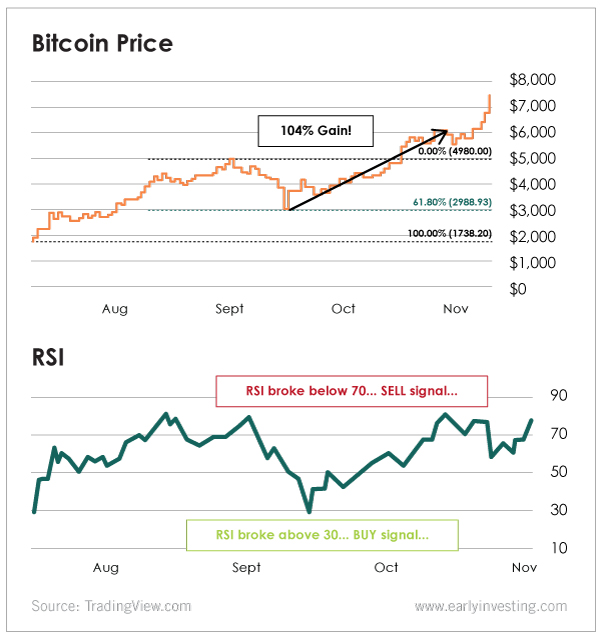
The price chart for bitcoin is on top, and the RSI indicator is on the bottom.
As you can see, RSI actually dropped below 30, then broke above it on the day bitcoin’s price bounced off the 61.8% Fibonacci retracement level… initiating Nakamoto’s Pattern!
In this instance, it was an excellent buy signal…
Not long after, RSI gave us a sell signal when it rose above and then broke below 70.
Had you traded bitcoin using just RSI, you could have doubled your money… earning a 104% gain in a few short weeks.
That’s not bad… at all. But as I’ve already shown you, bitcoin’s price surged far beyond that price in the months that followed.
So if you’re a conservative trader, using RSI as a sell signal alongside Nakamoto’s Pattern might work well for you.
In fact, I might even tell you to sell some of your holdings if this indicator tells us to sell.
But as I said, I’m a long-term investor at heart… I know that much bigger gains are possible for those willing to hang on for the ride.
And with my guidance, you’re well on your way to building a portfolio of extremely high-quality cryptocurrencies.
Good investing,
Adam Sharp